2026 Housing Market
The Raleigh housing market in 2026 is fundamentally different from past years and from the national housing market picture.
It’s been five years since the housing market completely lost its mind.
Five years of people asking the same question every year: When will the market get back to normal?
In 2026, the question has changed.
It’s not when anymore.
It’s will it ever be normal again?
And the honest answer is:
It depends where you live.
Because nationally, a lot of people are feeling stuck. Prices are high. Rates are high. And people are exhausted from waiting for conditions to improve.
But the Raleigh housing market in 2026 doesn’t follow the national script.
In this post, I want to show you three things:
- First, the national picture: We’ll look at the real ratio of household incomes to monthly payments to get an idea of why it’s so out of balance and how high incomes would need to be or how low home prices would need to be to balance things out.
- Second, we’ll look at why Raleigh breaks the national mold, using actual local data; forward-looking data that shows you the pulse of the market right now compared to pre-Covid days.
- And we’ll look at the economic picture in Raleigh compared to the rest of the country. Some towns in Raleigh are already back to a 2019 market and others… well let’s just say they aren’t. The towns that are the most economically balanced are not the ones you think they are.
Why the National Housing Market is Stuck
Renowned economist Elliott Eisenberg had this to say about the imbalance in the housing market:
To return home buyer affordability to its pre-Covid level, one of the following must happen:
- wages must rise 56%, lifting the median household wage to $132,000/year,
- the 30-year mortgage rate must fall 2.65% (assuming no resulting increase in home prices),
- or home prices need to slide 35%.
Or it could be a combination of those things.
For example, a 19% rise in wages would mean rates would only need to fall to 3.85%, combined with home prices falling 12%.

Why the Raleigh Housing Market in 2026 is different
But this isn’t the reality of the housing market in the Raleigh area. I went city by city applying Eisenberg’s metrics to get the same ratio of household income to the median home cost in that city. And I found a pretty shocking imbalance in some cities but not others. Even the unbalanced cities are not nearly as bad as the national picture but they are imbalanced.
All of that data is below, but first let’s get some context.
The Three Metrics to Watch
There are three metrics I like to look at to help me understand where the market is headed: The FLOW of the market, PRICING POWER, and URGENCY.
What I’m calling “flow” is the ratio of new listings to new pending sales.
A lot of real estate analysts look at something different called the absorption rate, which is the ratio of ALL listings on the market, to the number of sales in a month. When I look at new to pending sales I am only looking at the number of listings that went active that month and the number of sales that went pending that month.
So what’s the difference?
The absorption rate is this: If you have 500 homes on the market and 100 sell in a month, it’ll take 5 months to sell all the houses. But the truth is, not all the houses are going to sell because not all of them are a product that buyers want.
But here’s what I look at: In January in a particular town, 487 homes came onto the market. Also in January, 339 homes went under contract in less than 7 days. So 70% of homes go pending in a week. Even in January. But the other 30% sit there and each month we add a new group to them of dusty listings in bad condition that nobody wants.
And so if we look at the absorption rate, it says we have 3 months of listings on the market. And a buyer might think “oh, there is plenty to choose from,” when in reality, all the good homes that are priced well are going in 7 days. I want to give you a realistic picture of what the market is really doing.
So let’s start with the flow of the market.
#1 FLOW
In January 2026 in Wake County, 1672 homes came onto the market and 1298 went pending within 30 days. That’s a 78% listing-to-pending ratio.
Last January the listing to pending ratio was 72%.
In 2019, a pre-Covid, normal market… it was 83%.
So what does that tell us?
It tells us that the homes that buyers actually want are still getting absorbed very quickly. Homes are selling faster now than they were last year. And they are selling more slowly than they were before Covid.
Now that doesn’t mean everything is flying off the shelves. We still have those dusty listings. We still have homes sitting in poor condition or overpriced or dated layouts that people don’t like.
But if 78% of new listings are going under contract in the first month, that is not what a collapsing market looks like.
If the listing to pending ratio was the only metric we looked at, we might think the market was very competitive. But some of the news you’ve been hearing about the slower market is true. Now let’s look at pricing power.
# 2: Pricing Power
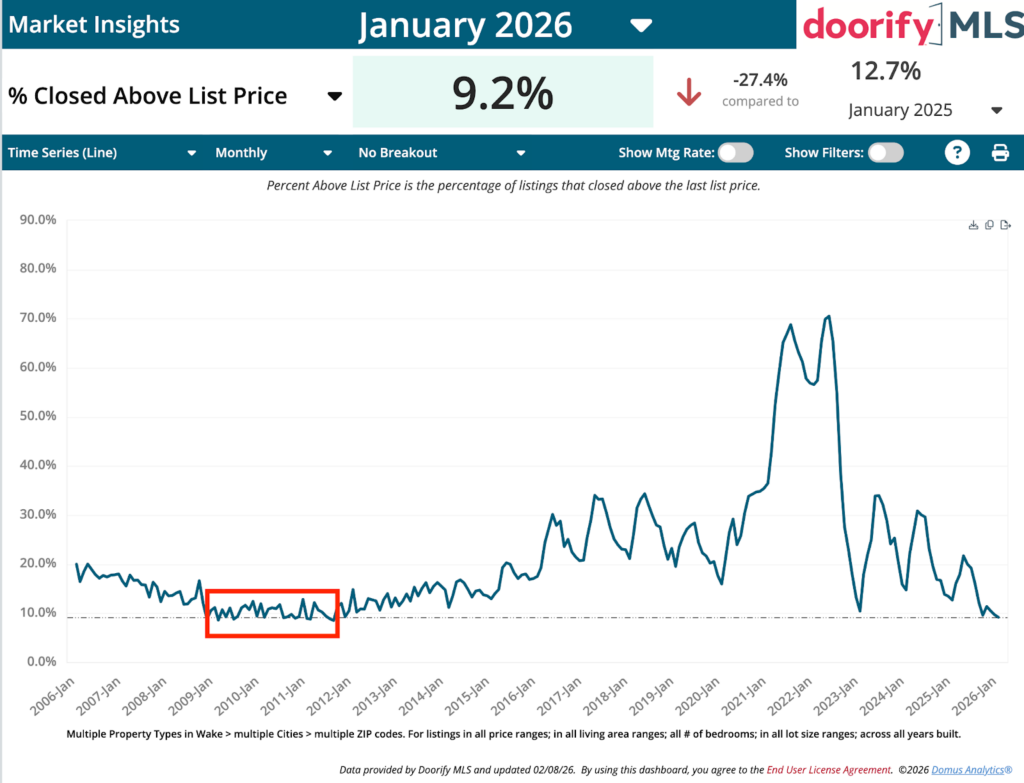
In 2026, 9.2% of homes are closing above list price.
Last year it was 12.7%.
In 2019 it was 19.5%.
In 2026 the number of competitive sales, where people bid over the list price has dropped to half of what it was BEFORE Covid.
That’s important.
Because it shows that the market IS leaning more towards a buyers market than it was before Covid. What’s also interesting is that these numbers look eerily similar to what the Raleigh housing market looked like not in 2019, but in 2009-2012, which was the bottom of the market after the 2008 crash. In January, over list offers percentages were:
- Jan 2007 – 14.5%
- Jan 2008 – 13.5%
- Jan 2009 – 11.2
- Jan 2010 – 12%
- Jan 2011 – 8.9%
- Jan 2012 – 14.8%
While pre-2008 didn’t have nearly the build up of frenzy as we did during Covid, the wintertime dynamics are looking similar.
Now let’s look at the percentage of original list price sellers are receiving.
In 2026, sellers are receiving about 95% of their original asking price.
Last year it was 96.6%.
In 2019 it was 97.4%.
So yes, there is more negotiating happening than there was pre-Covid.
If we compare this to several January’s after the 2008 crash, there were multiple years where the percent of list price received was around 91% in January sales.
Even though the percentage of over list offers is similar to what we saw post 2008, we’re not seeing the same kind of price discounting as we were then. It will be interesting to see what happens as we go through spring, but as it stands now, the lack of inventory is still protective of housing prices. Post 2008 we had a glut of inventory. But today, that isn’t the case.
# 3: Days on Market / Urgency
The third thing I look at is days on market.
In 2026, homes are sitting about 46 days.
Last year it was 37.
In 2019 it was 27.
So yes — homes are taking longer to sell than they did before Covid.
That’s true.
But the real question isn’t, “Are homes slower than 2021?”
Of course they are.
The real question is: Are they deteriorating?
And 46 days is not deterioration. Post 2008 the AVERAGE days on market in January ranged from 90-100 days. Our current market is still in the range of balance, not inventory piling up or distress.
When we look at all of this data together, this tells me that
- The homes that are priced correctly and presented well are still moving.
- The homes that are overpriced or dated are sitting.
There is still a demand for housing, the market is just sorting properties into desirable and not desirable.
So if our local data looks like a healthy market, why does the national picture feel so broken?
Jobs
One of the reasons the 2026 Raleigh housing market remains relatively calm here when other areas struggle is due to our very healthy economy. As I’ve said in other videos, Raleigh’s economy is very diversified, offering a lot of buffering and resilience from economic shifts. Technology, higher education, biopharmaceuticals, advanced manufacturing, and financial services all have a meaningful footprint here — so we’re not dependent on one single industry to carry the region.
When one sector cools, another often continues hiring. That diversification helps keep unemployment lower than the national average and supports steady wage growth, which in turn stabilizes housing demand even when interest rates are higher.
According to the Wall Street Journal, in 2026 Raleigh is the #1 city in the US where college graduates are actually landing jobs. Also, Raleigh’s labor market remains tighter than the national average, with the unemployment rate hovering around 3.0–3.6% locally, on a relatively flat trajectory, compared to 4.4% nationally, an upward trajectory according to the Bureau of Labor Statistics. That reflects stronger hiring conditions here than in much of the country.
While the U.S. economy added about 584,000 jobs in 2025, far below the growth of 2 million jobs seen in the previous year, the Raleigh area continued to see positive employment momentum with a roughly 1.4% over-the-year increase in jobs in the metro area, again showing stronger local job growth relative to the national trend.
And if you took all of this information I have shared so far, you would think the entire Triangle is doing incredibly and we have no problems.
But you would be wrong.
Affordability Benchmarks in the Triangle
There are massive swings in how balanced the housing market is from city to city.
Remember the economist from the beginning of the post who said wages would need to rise 56% nationally for housing costs to get back to 2019 ratios? I decided to apply the same affordability math to local cities and towns here in the Triangle.
I used a pre-Covid affordability benchmark of roughly 4× household income, and NO assumed drops or rises in home prices or changes to interest rates. For the towns that haven’t yet gotten back to precovid affordability, I assumed a 3.5% annual median household income increase to determine how long it would take to reach a balanced income to housing price ratio. And this is what I found.
Cary, Apex and Holly Springs have the highest home prices but also the highest incomes. Clayton and Zebulon have the lowest home prices but also the lowest incomes AND the longest time to balance assuming a 3.5% income increase per year. But there is more to the story. The 2026 Raleigh housing market isn’t monolithic.
Raleigh – Estimated time to pre-Covid balance: ~5 years
- — Median home price: $458,000
- — Balanced income: ≈ $114,500
- — Current income: ≈ $96,000
- — Gap to equilibrium: ~19%
Cary – Estimated time to balance: ~5 years
- — Median home price: $612,000
- — Balanced income: ≈ $153,000
- — Current income: ≈ $129,000
- — Gap to equilibrium: ~18%
Apex – Estimated time to balance: ~2 years
- — Median home price: $615,000
- — Balanced income: ≈ $154,000
- — Current income: ≈ $138,000
- — Gap to equilibrium: ~11%
Holly Springs – Estimated time to balance: ~4 years
- — Median home price: $606,000
- — Balanced income: ≈ $151,500
- — Current income: ≈ $132,000
- — Gap to equilibrium: ~14%
Fuquay-Varina – Essentially balanced with one year of normal wage growth
- — Median home price: $453,000
- — Balanced income: ≈ $113,250
- — Current income: ≈ $111,000
- — Gap to equilibrium: ~2%
Wendell – Estimated time to balance: ~1 year
- — Median price: $387,500
- — Balanced income: ≈ $96,900
- — Current income: ≈ $94,000
- — Gap: ~3%
Clayton – Estimated time to balance: ~7 years
- — Median price: $364,000
- — Balanced income: ≈ $91,000
- — Current income: ≈ $73,000
- — Gap: ~25%
Zebulon – Estimated time to balance: ~9 years
- — Median price: $350,000
- — Balanced income: ≈ $87,500
- — Current income: ≈ $59,000
- — Gap: ~33%
Explaining all that DATA
So how are incomes so high in Cary and Apex but also so far from a balanced market and how are the areas with the cheapest housing the furthest from a balanced market? It seems a bit counter intuitive, but it actually makes sense.
Income is not the same as Net Worth
The highest priced areas ARE out of balance, even though they have higher incomes as well. But here’s the thing. Ferraris aren’t affordable.
But as long as there is a segment of the population who can afford them, the market can support the price. Just having high prices doesn’t mean the market is out of balance. Unaffordable for some? Of course. The question is, are there enough people who can afford a Ferrari for the number of Ferraris made? Or in our case, are there enough buyers who can afford the expensive homes in the Cary market?
Here’s the thing… using the median income to determine affordability, DOESN’T take into account people whose net worth is high but still make the median income.
So how can their net worth become so high on the median income?
The Impact of Relocation Buyers
There’s a few ways but the two I have seen play into our situation are these: Home equity in higher cost of living areas and stock portfolios that have surged. While relocation moves are not as high as they were during the Pandemic, North Carolina was a center for relocation long before 2020. People move from Washington DC, San Francisco, New York, Seattle, Los Angeles.
According to the National Movers Survey, North Carolina is still in the top 10 states for inbound moves. People come here because there are jobs in their fields and they can have a really nice quality of life at a much more affordable price. So if you sell a home in San Francisco that has appreciated in value over the years. and you have a big chunk to put down on a cheaper but much nicer home here, the cost of housing isn’t as large a percentage of income as it is if you’re doing a typical conventional loan with 10% down. This makes the debt to income much more affordable.
Another way net worth is making housing more affordable… people even with moderate incomes may use their retirement or other investments to buy down the cost of a home, making it cheaper on a monthly basis.
Or sometimes they get paid partially in company stock.
This gives them resources to buy down the cost of housing, again, so their income isn’t stretched as much when buying a home. Stocks have done incredibly well over the last few years so, even though food and housing prices are more expensive, many people have more money at their finger tips and it’s allowing home prices to not drop to the extent that some people think they should be if they are just looking at income to housing debt ratios.
And this really isn’t always “wealthy” people. Lots of people who are solidly middle class have been able to take advantage of the increasing stock market and home values. This market is primarily harder for those who have never invested or first time buyers, but those who have stayed in markets for 10 years or more, are still buying houses. Especially if they are willing to relocate.
Census Data Lags Population Change
The story is actually similar on the east side, but coming from a different group of people.
Incomes in Clayton and Zebulon are based on the 2020 census. But the population has exploded on the east side, and it’s messing with the numbers.
Since 2020, Zebulon has grown by 34% from a population of 7000 to a population of 10,500. Homes here aren’t being built for the current population. Zebulon’s primary sources of income are administrative assistant work and construction work. The average general construction worker makes about 40,000 a year. Administrative assistants make less than that… about 33,000. And no these homes aren’t being built for them because they can’t afford these homes.
These homes are being built for relocators who work in professional roles with salaries much higher than many of the locals and they CAN afford these homes. I think the census data the next time around will show much higher salaries. Yes, the census data was also impacting salary accuracy in Raleigh, but the tiny population on the east side skews the data even more.
The Growth of the 55+ Market
Another market that is having an impact on housing prices in Clayton is the 55+ market.
Dell Webb is a 55+ community with a total of 1500 new homes in the community. Most, if not all, of these homes are well above the median home price in Clayton, and many of the homes are bought with cash from sales in other higher priced metros.
The retiree’s incomes are not necessarily well above the median income, but their homes are well above the median home price for the area.
Consider this. Since the pandemic, Americans have gotten wealthier on paper not just because home values jumped, but because stock and other financial assets climbed too. Federal Reserve data shows total household net worth has grown significantly above pre-Covid levels, with median household net worth rising roughly from about $136,500 in 2019 to around $176,500 by 2022 as home equity and financial assets increased.
What that means is this: a lot of buyers coming here aren’t buying with just salary dollars. They’re drawing on built-up equity and investments — whether from selling a home in a higher-priced market or from gains in the stock market — and that softens the monthly cost burden even when sticker prices look high.
Debt to income no longer tells the true story of housing availability.
Net worth is propping up home prices and creating a dividing line between who can buy and who can’t.
It’s confusing the conversation around whether the housing market is sustainable as it currently stands. But in Raleigh, a variety of home prices allows a greater portion of the buyer pool to get into the housing market, softening the wealth dynamic, continuing to make it a great place to live and build a home.